


支持指标
Cloud Insight PHP-FPM 监控,默认监控以下性能指标:
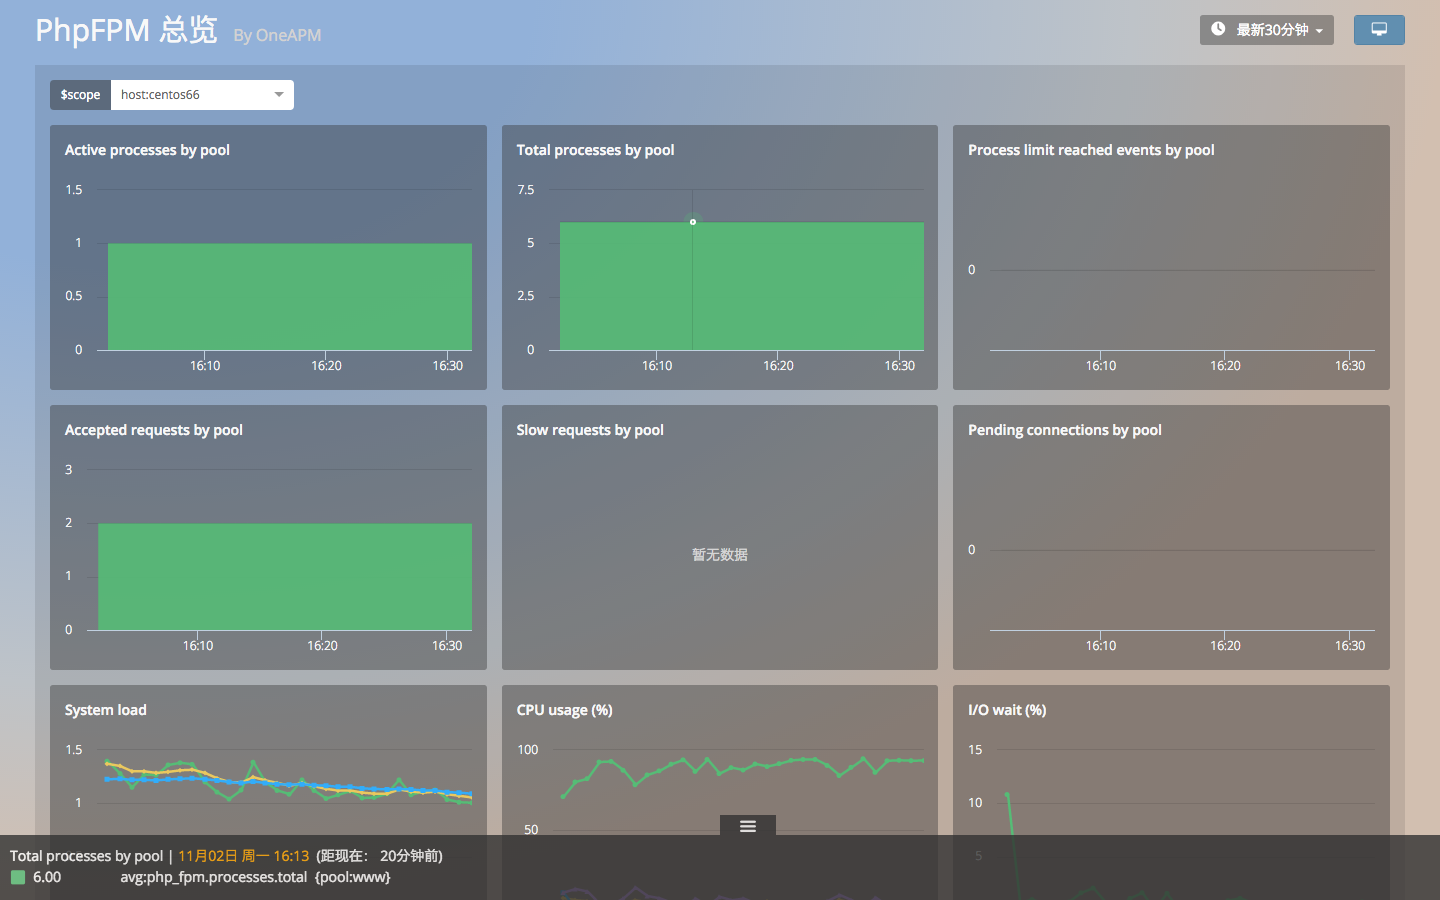
- phpfpm.listen_queue.size
- phpfpm.processes.active
- phpfpm.processes.active
- phpfpm.processes.max_reached
- phpfpm.processes.total
- phpfpm.requests.accepted
- phpfpm.requests.slow
简易安装
想要可视化 PHP-FPM 的性能,往往需要自建运维系统:利用 Zabbix 等开源工具搭建运维监控平台。这往往意味着大量的工作,以及繁琐的调试过程。
而报警、指标的运算、不同主机间数据的聚合,以及自定义指标的可视化,都需要对接新的开源工具。从而,更多的时间成本和人力成本,会投入进来。
Cloud Insight 探针的安装只需一条指令,且提供 Puppet 对探针进行批量处理。监控 PHP-FPM 也只需开启 PHP-FPM 配置文件。过程十分简单。
而且,Cloud Insight 数据的自动抓取和上传,以及丰富的可视化效果,再加上多渠道的报警。让您免于自建运维监控系统的困扰。
数据管理
Cloud Insight 数据管理功能,能够针对集群中,不同主机的 PHP-FPM 性能指标,进行聚合、过滤、分组。
通过简单的指标查询,能够快速了解分属于不同功能模块、地域、网段的 PHP-FPM 的性能的最大值、平均值、最小值。让运维工作更简单、更敏捷。
开启 PHP-FPM 监控
2. 编辑配置文件
编辑配置文件 conf.d/php_fpm.yaml,使 Cloud Insight Agent 可以与 FPM 终端通信,有关终端信息请查看线程池配置。
		                        			init_config:


		                        			instances:

		                        			- # Get metrics from your FPM pool with this URL

		                        			status_url: http://localhost/status

		                        			# Get a reliable service check of you FPM pool with that one

		                        			ping_url: http://localhost/ping

		                        			# These 2 URLs should follow the options from your FPM pool

		                        			# See http://php.net/manual/en/install.fpm.configuration.php

		                        			#   * phpfpm.pm.status_path

		                        			#   * phpfpm.ping.path

		                        			# You should configure your fastcgi passthru (nginx/apache) to

		                        			# catch these URLs and redirect them through the FPM pool target

		                        			# you want to monitor (FPM `listen` directive in the config, usually

		                        			# a UNIX socket or TCP socket.

		                        			#

		                        			# Use this if you have basic authentication on these pages

		                        			# user: cloudinsight

		                        			# password: ONEAPM

		                        			#

		                        			# Array of custom tags

		                        			# By default metrics and service check will be tagged by pool and host

		                        			# tags:

		                        			#   - tag_key:tag_value
3. 重启 Agent
重启 OneAPM Cloud Insight Agent,使配置生效。


一个为程序员而生的产品
一次改变开发习惯的机遇


销售经理为您解答专业版 OneAPM 报价、部署实施方案的各种问题。
销售咨询400-181-0833

使用 OneAPM 时,遇到任何技术上的问题,都可以直接致电技术支持专线。
技术支持400-181-0833