


支持指标
Cloud Insight Tomcat 监控,默认监控以下性能指标:
- tomcat.docker.containers.running
- tomcat.bytes_rcvd
- tomcat.bytes_sent
- tomcat.error_count
- tomcat.max_time
- tomcat.processing_time
- tomcat.request_count
- tomcat.servlet.error_count
- tomcat.servlet.processing_time
- tomcat.servlet.request_count
- tomcat.threads.busy
- tomcat.threads.count
- tomcat.threads.max
- jvm.gc.cms.count
- jvm.gc.parnew.time
- jvm.heap_memory
- jvm.heap_memory_committed
- jvm.heap_memory_init
- jvm.heap_memory_max
- jvm.non_heap_memory
- jvm.non_heap_memory_committed
- jvm.non_heap_memory_init
- jvm.non_heap_memory_max
- jvm.thread_count
- jmx.catalina.jsp_count
- jmx.catalina.jsp_queue_length
- jmx.catalina.jsp_reload_count
- jmx.catalina.jsp_unload_count
简易安装
想要可视化 Tomcat 的性能,往往需要自建运维系统:利用 Zabbix 等开源工具搭建运维监控平台。这往往意味着大量的工作,以及繁琐的调试过程。
而报警、指标的运算、不同主机间数据的聚合,以及自定义指标的可视化,都需要对接新的开源工具。从而,更多的时间成本和人力成本,会投入进来。
Cloud Insight 探针的安装只需一条指令,且提供 Puppet 对探针进行批量处理。监控 Tomcat 也只需开启 Docker 配置文件。过程十分简单。
而且,Cloud Insight 数据的自动抓取和上传,以及丰富的可视化效果,再加上多渠道的报警。让您免于自建运维监控系统的困扰。
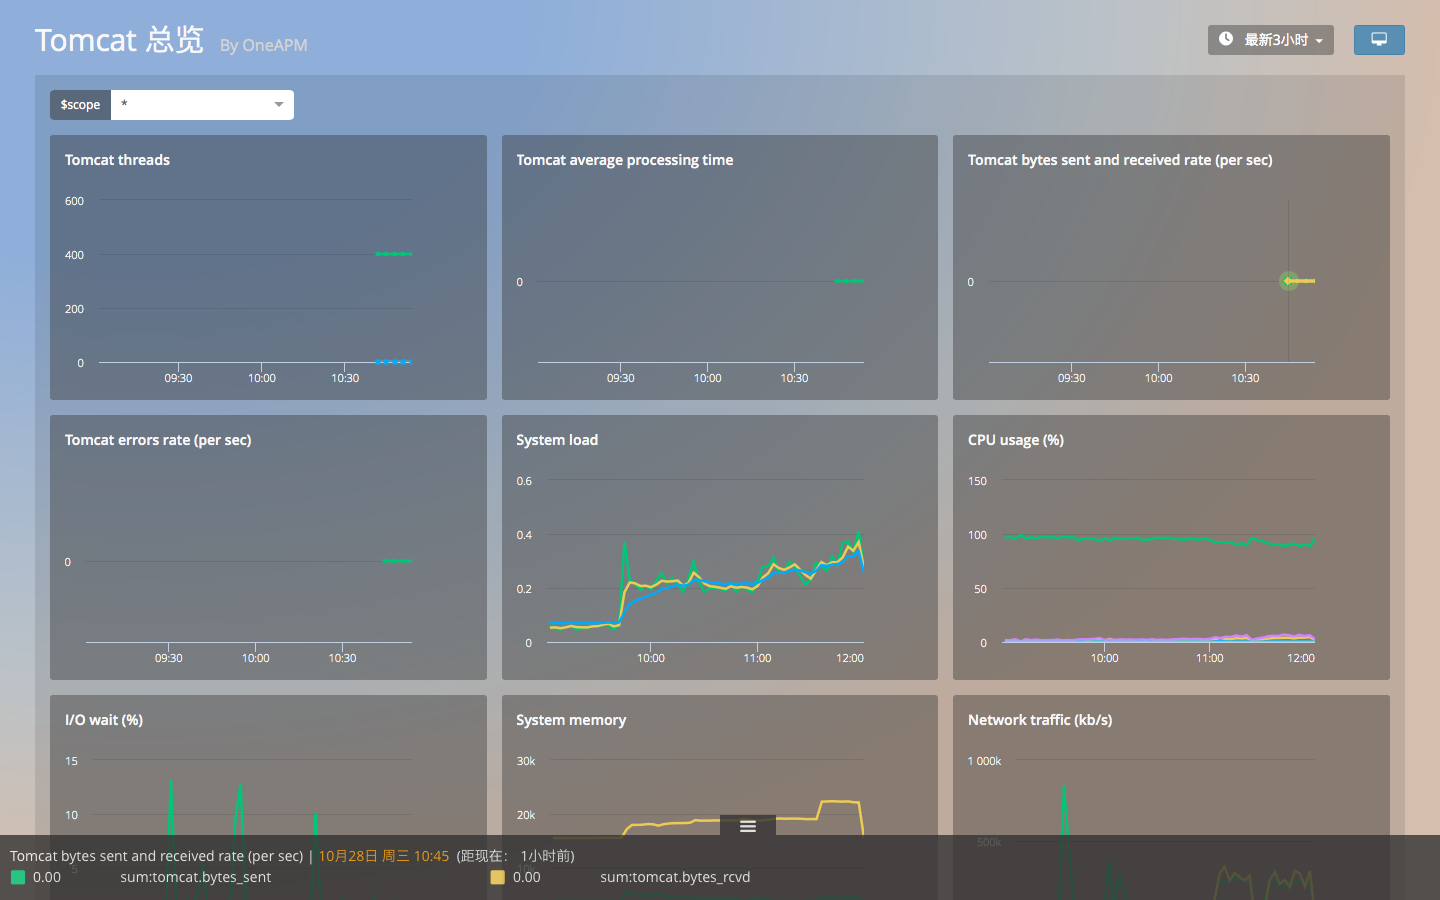
数据管理
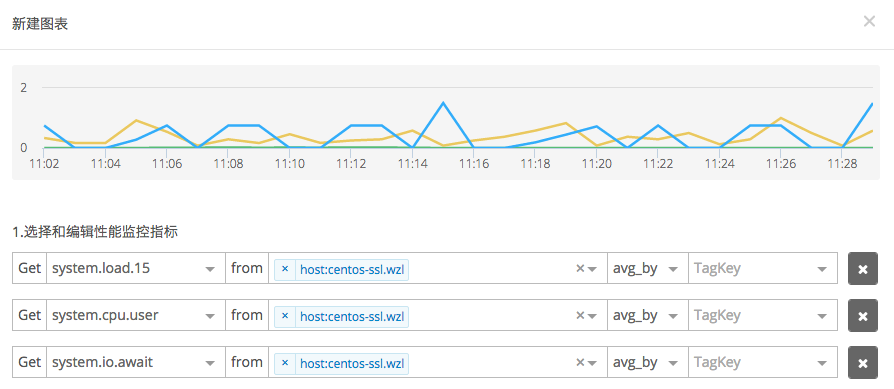
Cloud Insight 数据管理功能,能够针对集群中,不同主机的 Tomcat 性能指标,进行聚合、过滤、分组。
通过简单的指标查询,能够快速了解分属于不同功能模块、地域、网段的 Tomcat 的性能的最大值、平均值、最小值。让运维工作更简单、更敏捷。
开启 Tomcat 监控
1. 启动 JMX Remote
OneAPM Cloud Insight Agent 通过 JMX 获取 Tomcat 中的性能指标,所以确保 JMX Remote 是 enabled 状态。
2. 编辑配置文件
编辑配置文件 conf.d/tomcat.yaml,使 Cloud Insight Agent 可以与 Tomcat 通信。
											instances:

											- host: localhost

											port: 7199

											user: username

											password: password

											name: tomcat_instance


											# List of metrics to be collected by the integration


											init_config:

											conf:

											- include:

											type: ThreadPool

											attribute:

											maxThreads:

											alias: tomcat.threads.max

            								metric_type: gauge

            								currentThreadCount:

											alias: tomcat.threads.count

            								metric_type: gauge

            								currentThreadsBusy:

											alias: tomcat.threads.busy

            								metric_type: gauge


            								- include:

											type: GlobalRequestProcessor

											attribute:

											bytesSent:

											alias: tomcat.bytes_sent

            								metric_type: counter

            								bytesReceived:

											alias: tomcat.bytes_rcvd

            								metric_type: counter

            								errorCount:

											alias: tomcat.error_count

            								metric_type: counter


            								- include:

											j2eeType: Servlet

											attribute:

											processingTime:

											alias: tomcat.servlet.processing_time

            								metric_type: counter

            								errorCount:

											alias: tomcat.servlet.error_count

            								metric_type: counter

            								requestCount:

											alias: tomcat.servlet.request_count

            								metric_type: counter


            								- include:

            								type: Cache

											accessCount:

											alias: tomcat.cache.access_count

											metric_type: counter

											hitsCounts:

											alias: tomcat.cache.hits_count

											metric_type: counter


            								- include:

            								type: JspMonitor

											jspCount:

											alias: tomcat.jsp.count

											metric_type: counter

											jspReloadCount:

											alias: tomcat.jsp.reload_count

											metric_type: counter
3. 重启 Agent
重启 OneAPM Cloud Insight Agent,使配置生效。


一个为程序员而生的产品
一次改变开发习惯的机遇


销售经理为您解答专业版 OneAPM 报价、部署实施方案的各种问题。
销售咨询400-181-0833

使用 OneAPM 时,遇到任何技术上的问题,都可以直接致电技术支持专线。
技术支持400-181-0833